empty
16.01.2025 04:19 AM
Trading Recommendations and Analysis for EUR/USD on January 16: Another Logical Collapse

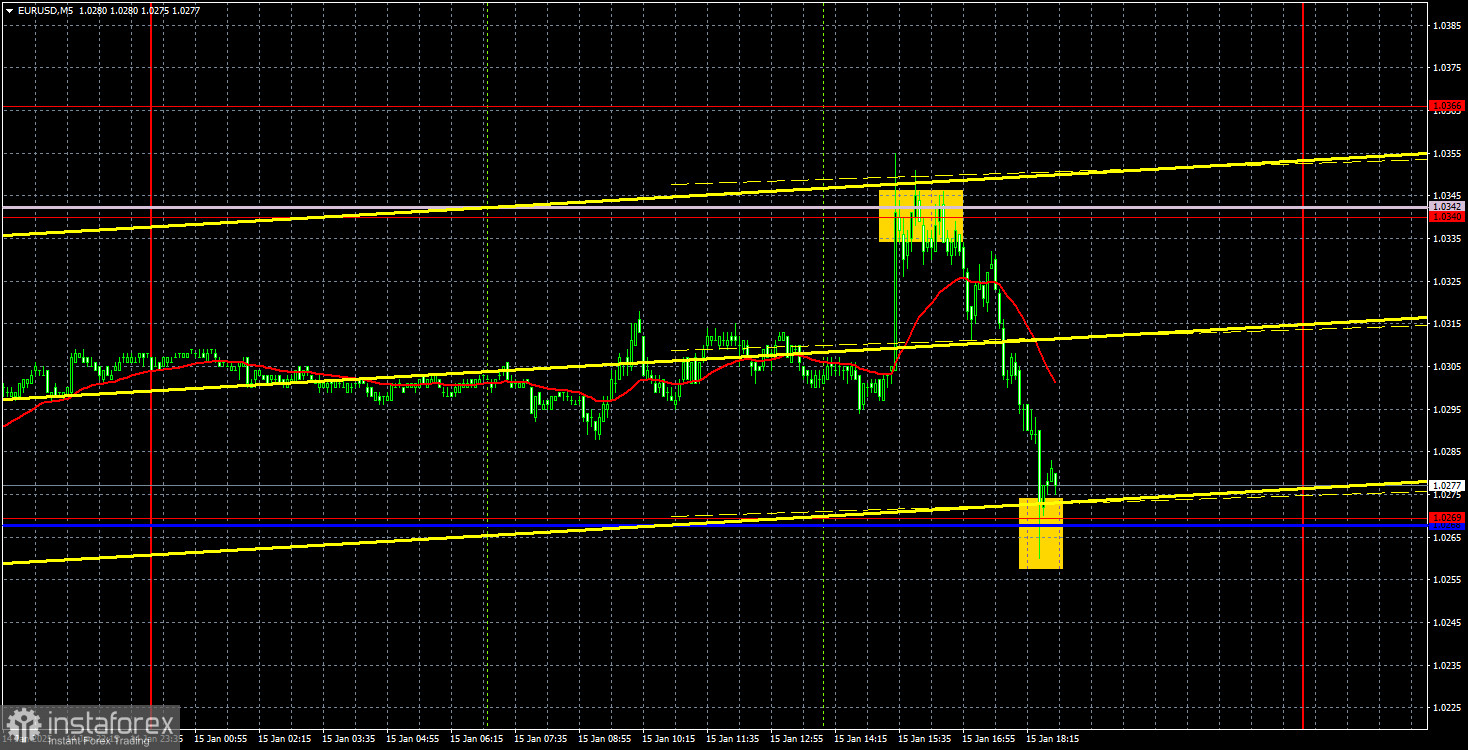
EUR/USD 5-Minute Analysis

This image is no longer relevant

On Wednesday, the EUR/USD currency pair initially traded upward for most of the day but later lost all its gains as the euro declined significantly. In our fundamental analysis, we highlighted the mixed nature of the U.S. inflation report. The market's initial reaction was to sell the dollar, which seemed somewhat irrational. While the headline inflation figure met expectations, U.S. inflation still increased, indicating that the Federal Reserve might not lower rates as much as the two modest rate cuts anticipated in 2025. This situation is further complicated by Donald Trump's upcoming presidency, which may bring various tariffs that could escalate global inflation.

The evening decline in the euro was more understandable. First, the global downtrend remains in effect. Second, the fundamental and macroeconomic conditions continue to favor the dollar. Third, the price corrected and rebounded precisely from the Senkou Span B line. Even on the previous day, there were reasons to consider buying the dollar again, despite the mixed inflation report.

Trading signals on Wednesday were excellent. During the U.S. session, the currency pair tested the 1.0340 level and the Senkou Span B line, rebounding sharply. This was followed by a decline that again tested this critical line, from which the price also bounced. As a result, traders had the opportunity to open two trades that yielded profit. A long position can even be maintained.
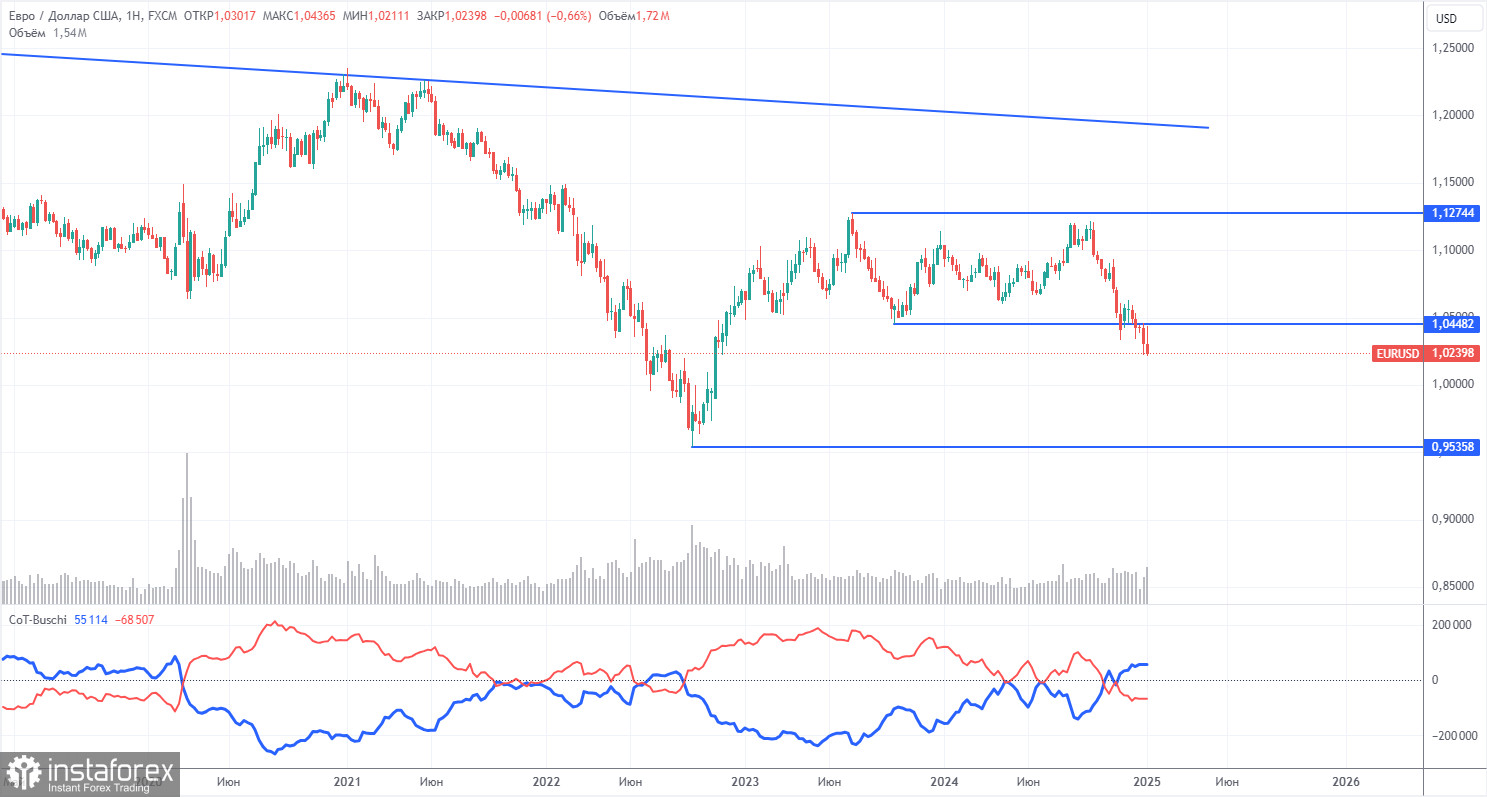
COT Report

This image is no longer relevant

The latest Commitment of Traders (COT) report, dated December 31, indicates that non-commercial traders maintain a bullish net position. However, bears have recently gained the upper hand. Two months ago, the number of short positions among professional traders surged, resulting in a negative net position for the first time in a long while. This change suggests that the euro is being sold more frequently than it is being bought.

We have yet to identify any fundamental drivers for euro strength. From a technical perspective, the EUR/USD pair has been consolidating for quite some time. On the weekly timeframe, it has traded between 1.0448 and 1.1274 since December 2022. The breach of the 1.0448 level has opened the door for further declines.

Additionally, the COT data shows that the red and blue lines have crossed, signaling a bearish market sentiment. In the last reporting week, long positions among non-commercial traders increased by 9,300, while short positions rose by 10,400, resulting in a reduction of the net position by 1,100.

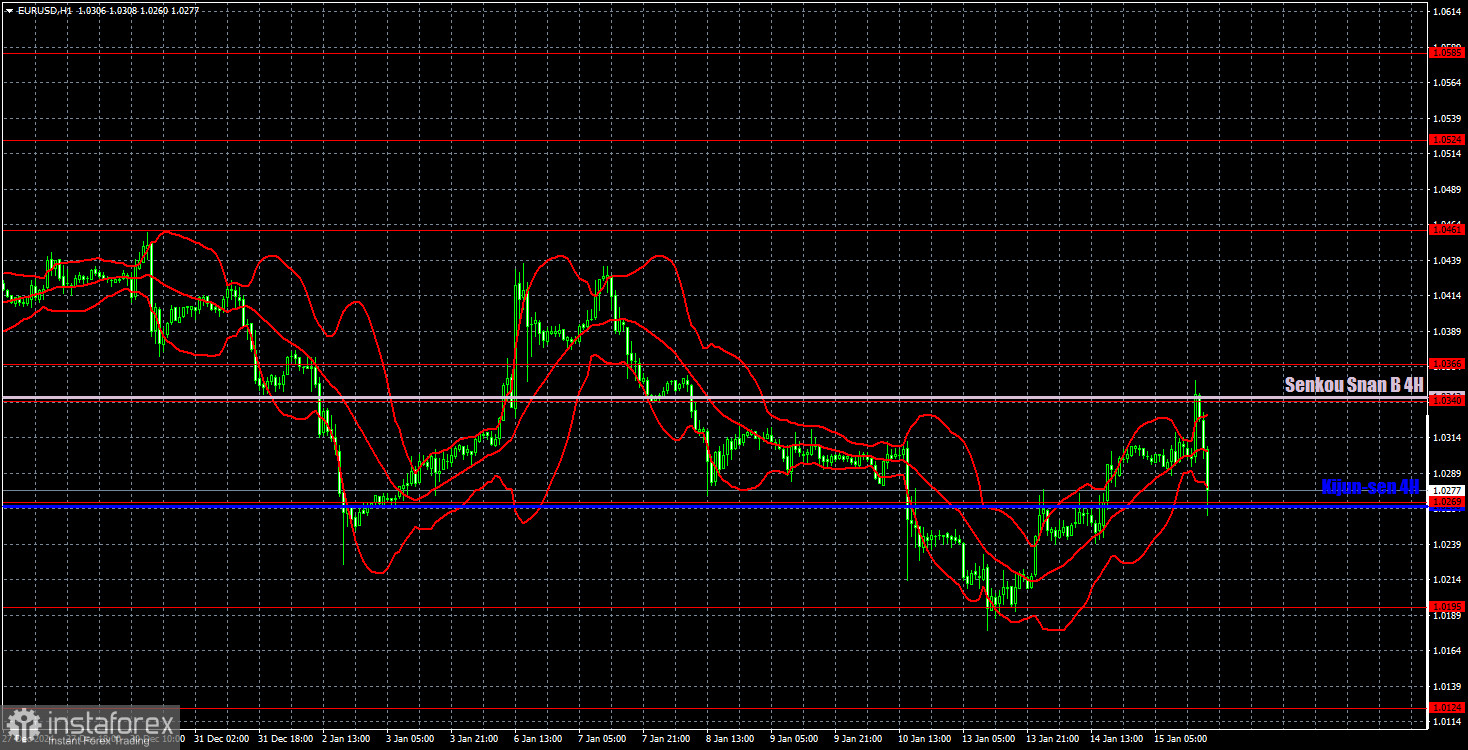
EUR/USD 1-Hour Analysis

This image is no longer relevant

On the hourly chart, the currency pair has resumed its downtrend, which has persisted for over three months. We believe this decline will continue in the medium term. The Fed might cut interest rates just 1–2 times in 2025, indicating a more hawkish stance than the market initially expected. This factor, among others, will continue to support the U.S. dollar. The bearish sentiment remains intact below the Ichimoku indicator lines, even in the short term.

For trading on January 16, the following levels are highlighted: 1.0124, 1.0195, 1.0269, 1.0340–1.0366, 1.0461, 1.0524, 1.0585, 1.0658–1.0669, 1.0757, 1.0797, and 1.0843, as well as the Senkou Span B (1.0342) and Kijun-sen (1.0267) lines. Please note that the Ichimoku indicator lines may shift throughout the day, which should be considered when determining trading signals. Remember to set a Stop Loss at breakeven if the price moves 15 pips in your favor, to protect against potential losses from false signals.

On Thursday, the Eurozone will release a secondary report on German inflation, while the U.S. is set to publish slightly more significant retail sales data and equally secondary jobless claims. Therefore, we do not expect strong price movements today. Below the Senkou Span B line, even a short-term uptrend remains unlikely.

Illustration Explanations:

  • Support and Resistance Levels (thick red lines): Thick red lines indicate where movement may come to an end. Please note that these lines are not sources of trading signals.
  • Kijun-sen and Senkou Span B Lines: Ichimoku indicator lines transferred from the 4-hour timeframe to the hourly timeframe. These are strong lines.
  • Extreme Levels (thin red lines): Thin red lines where the price has previously bounced. These serve as sources of trading signals.
  • Yellow Lines: Trendlines, trend channels, or any other technical patterns.
  • Indicator 1 on COT Charts: Represents the net position size for each category of traders.
Paolo Greco,
Analytical expert of InstaForex
© 2007-2025
Summary
Urgency
Analytic
Stanislav Polyanskiy
Start trade
Earn on cryptocurrency rate changes with InstaForex
Download MetaTrader 4 and open your first trade
  • Grand Choice
    Contest by
    InstaForex
    InstaForex always strives to help you
    fulfill your biggest dreams.
    JOIN CONTEST

Recommended Stories

Trading Recommendations and Trade Analysis for EUR/USD on November 14. The Euro Currency Finds a Good Moment

The EUR/USD currency pair continued its upward movement on Thursday, which has intensified. So what happened yesterday that caused the euro to accelerate its growth while the dollar declined

Paolo Greco 02:44 2025-11-14 UTC+2

How to Trade the GBP/USD Currency Pair on November 13? Simple Tips and Trade Analysis for Beginners

The GBP/USD pair again gravitated toward decline throughout Wednesday but failed to settle below the level of 1.3107, which still gives the British currency a chance for growth. However, today

Paolo Greco 06:00 2025-11-13 UTC+2

How to Trade the EUR/USD Currency Pair on November 13? Simple Tips and Trade Analysis for Beginners

On Wednesday, the EUR/USD currency pair continued to endure its trials. Recall that the euro has been experiencing a total flat for several months, which is clearly visible

Paolo Greco 06:00 2025-11-13 UTC+2

Trading Recommendations and Trade Analysis for GBP/USD on November 13. Pound Falls Again

The GBP/USD currency pair started on Wednesday with another decline, which is quite difficult to explain. If the day before there was an outright disappointing unemployment report

Paolo Greco 02:09 2025-11-13 UTC+2

Trading Recommendations and Trade Analysis for EUR/USD on November 13. Euro Holds Its Position

The EUR/USD currency pair attempted to enter a new phase of downward movement on Wednesday, but technical factors prevented it. Throughout the day, there were no significant reports

Paolo Greco 02:09 2025-11-13 UTC+2

How to Trade the GBP/USD Currency Pair on November 12? Simple Tips and Trade Analysis for Beginners

The GBP/USD pair traded up and down throughout Tuesday. In the morning, the only data published in the UK provided traders with some basis for opening trading positions. In principle

Paolo Greco 06:12 2025-11-12 UTC+2

How to Trade the EUR/USD Currency Pair on November 12? Simple Tips and Trade Analysis for Beginners

The EUR/USD currency pair continued its upward movement on Tuesday, despite virtually no macroeconomic data or fundamental events. Recall that on Monday, Donald Trump announced that the "shutdown" could

Paolo Greco 06:12 2025-11-12 UTC+2

Trading Recommendations and Trade Analysis for GBP/USD on November 12. The Pound Did Not Lament for Long

The GBP/USD currency pair started Tuesday on a downward trajectory. It cannot be said that this decline was significant – only 45 pips. By the end of the American trading

Paolo Greco 02:08 2025-11-12 UTC+2

EUR/USD: Trading Recommendations and Analysis for November 12. The Dollar Failed to Benefit from Shutdown News

The EUR/USD currency pair continued its upward movement on Tuesday, as anticipated. Despite the absence of significant events yesterday and the expectation that news of the upcoming

Paolo Greco 02:08 2025-11-12 UTC+2

How to Trade the GBP/USD Currency Pair on November 11? Simple Tips and Trade Analysis for Beginners

The GBP/USD pair attempted to continue its upward movement from recent days on Monday, but overall, it moved sideways more than up. This is not surprising, as no significant news

Paolo Greco 05:31 2025-11-11 UTC+2
Can't speak right now?
Ask your question in the chat.
Widget callback
 

Dear visitor,

Your IP address shows that you are currently located in the USA. If you are a resident of the United States, you are prohibited from using the services of InstaFintech Group including online trading, online transfers, deposit/withdrawal of funds, etc.

If you think you are seeing this message by mistake and your location is not the US, kindly proceed to the website. Otherwise, you must leave the website in order to comply with government restrictions.

Why does your IP address show your location as the USA?

  • - you are using a VPN provided by a hosting company based in the United States;
  • - your IP does not have proper WHOIS records;
  • - an error occurred in the WHOIS geolocation database.

Please confirm whether you are a US resident or not by clicking the relevant button below. If you choose the wrong option, being a US resident, you will not be able to open an account with InstaForex anyway.

We are sorry for any inconvenience caused by this message.