empty
25.03.2025 07:04 PM
EUR/USD. March 25th. A Dull Week Ahead

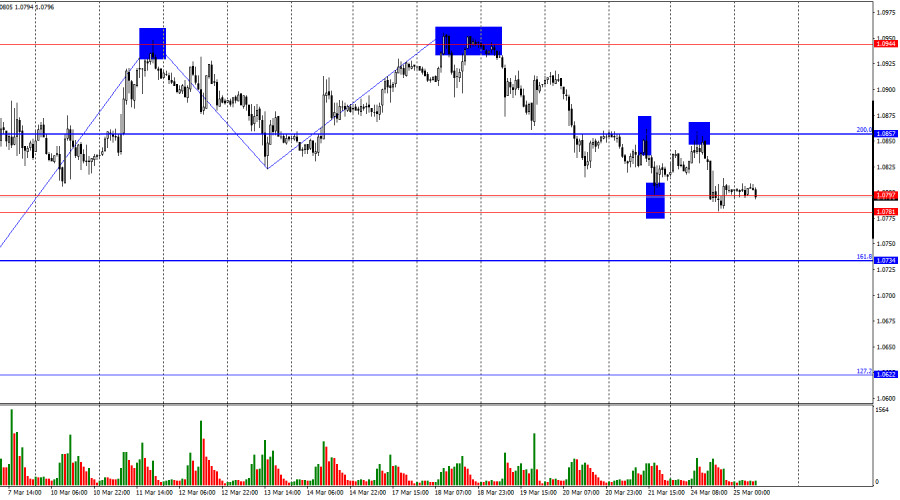
On Monday, the EUR/USD pair rebounded from the 200.0% Fibonacci retracement level at 1.0857, reversed in favor of the U.S. dollar, and declined toward the support zone of 1.0781–1.0797. A rebound from this zone today would favor the euro and trigger a new upward move toward the 1.0857 level. A firm consolidation below this zone will increase the likelihood of a continued decline toward the next Fibonacci level of 161.8% at 1.0734.

This image is no longer relevant

The wave situation on the hourly chart has changed. The last completed upward wave only slightly surpassed the previous peak, while the most recent downward wave barely broke the previous low. As a result, the current wave pattern still points to a bullish trend, but it may begin to reverse soon as the bulls appear to have run out of momentum. For several weeks, Donald Trump's tariffs have put strong pressure on the dollar, but this won't last forever.

On Monday, the news background was of interest to traders, but most of the reports failed to answer the key question: what to do with the euro and the dollar? PMI data can often hint at future economic trends, but yesterday wasn't one of those days. Manufacturing PMIs in Germany and the Eurozone improved, but the Services PMIs declined. Overall, it's hard to say whether the European economy is recovering or slowing down. In my view, it's doing neither — it's stagnating.

There will be few important events this week, so traders may shift their focus to next week when the news background becomes more significant. In early April, we'll find out which tariffs Donald Trump plans to impose on trade partners around the world, which could have a highly negative impact on bearish positions. Historically, markets have reacted very negatively to the introduction of tariffs. For now, the dollar is enjoying a brief reprieve.

This image is no longer relevant

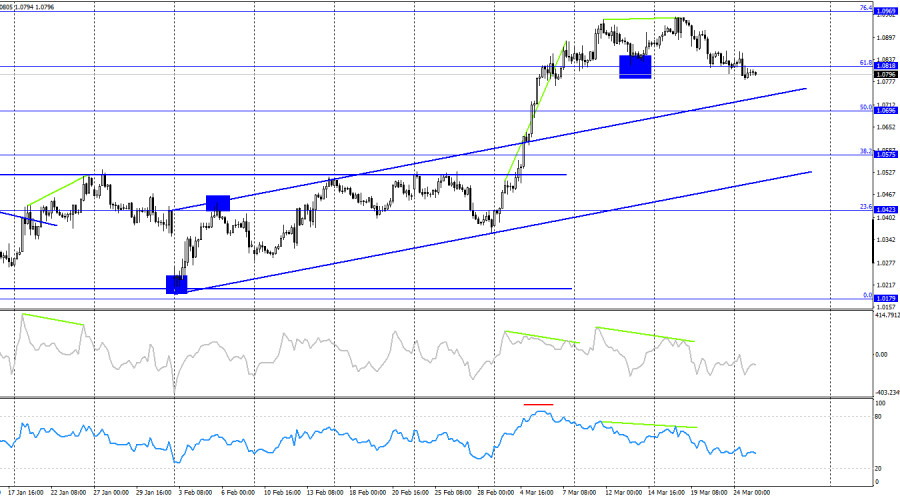
On the 4-hour chart, the pair reversed in favor of the U.S. dollar following another "bearish" divergence and closed below the 61.8% Fibonacci level at 1.0818. Therefore, a further decline toward the next retracement level of 50.0% at 1.0696 can be expected. The euro has room to fall, as the price is still above the ascending trend channel. No new divergences are currently forming on any indicator.

Commitments of Traders (COT) Report:

This image is no longer relevant

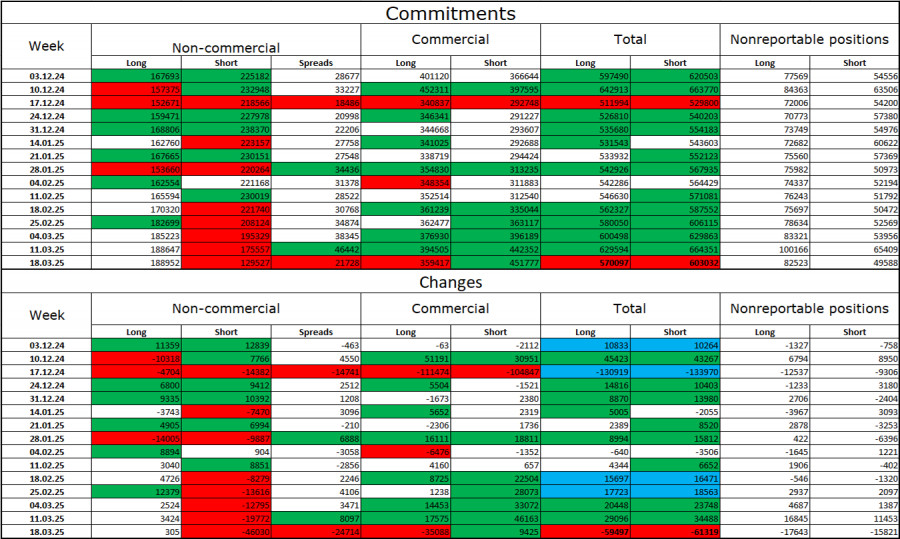
During the last reporting week, professional traders opened 305 new long positions and closed 46,030 short positions. The sentiment of the "Non-commercial" group has turned bullish again — thanks to Donald Trump. The total number of long positions held by speculators now stands at 189,000, while short positions have decreased to 129,000.

For 20 consecutive weeks, large traders had been selling off the euro, but they've now been cutting short positions and increasing longs for six weeks in a row. The divergence in monetary policy approaches between the ECB and the Fed still favors the U.S. dollar due to the interest rate differential. However, Donald Trump's policy is now a stronger factor for traders, as it may push the Fed toward a more dovish stance and potentially trigger a recession in the U.S. economy.

News Calendar for the U.S. and the Eurozone:

Eurozone – Ifo Business Climate Index in Germany (09:00 UTC) U.S. – New Home Sales (14:00 UTC)

The economic calendar for March 25 includes two secondary-tier releases. The news background is expected to have a very weak influence on market sentiment on Tuesday.

EUR/USD Forecast and Trader Tips:

Selling the pair was possible after a rebound from 1.0944 and 1.0857 on the hourly chart, targeting 1.0857 and 1.0797 — all of which were achieved. New short positions will be possible upon a confirmed break below the 1.0781–1.0797 zone, with targets at 1.0734 and 1.0622. Buying can be considered after a rebound from the 1.0781–1.0797 zone on the hourly chart, targeting 1.0857.

Fibonacci grids are plotted from 1.0529–1.0213 on the hourly chart and from 1.1214–1.0179 on the 4-hour chart.

Samir Klishi,
انسٹافاریکس کا تجزیاتی ماہر
© 2007-2025
Summary
Urgency
Analytic
Grigory Sokolov
Start trade
انسٹافاریکس کے ساتھ کرپٹو کرنسی کی معاملاتی تبدیلیوں سے کمائیں۔
میٹا ٹریڈر 4 ڈاؤن لوڈ کریں اور اپنی پہلی ٹریڈ کھولیں۔
  • Grand Choice
    Contest by
    InstaForex
    InstaForex always strives to help you
    fulfill your biggest dreams.
    مقابلہ میں شامل ہوں

تجویز کردہ مضامین

اکتوبر 31 2025 کو یورو / یو ایس دی کی پیشن گوئی

جمعرات کو، یورو / یو ایس ڈی پئیر 1.1594 پر 61.8% فیبوناچی کی سطح سے ریباؤنڈ ہوا، ایک مختصر اوپر کی حرکت دکھائی، اور پھر تیزی سے گرا، 1.1594

Samir Klishi 16:28 2025-10-31 UTC+2

اکتوبر 30-31 2025 کے لیے سونے (ایکس اے یو / یو ایس ڈی) کے لیے تجارتی سگنل: $3,950 سے اوپر خریدیں (200 ای ایم اے - 5/8 مرے)

ہفتے کے آغاز میں، سونے نے 4,106 کے ارد گرد ایک فرق چھوڑا، اور امکان ہے کہ اگر قیمت 3,950 سے اوپر مستحکم ہو جاتی ہے، تو ہم توقع

Dimitrios Zappas 17:57 2025-10-30 UTC+2

اکتوبر 30-31 2025 کے لیے یورو / یو ایس ڈی کے لیے تجارتی سگنل: 1.1570 سے اوپر خریدیں (200 ای ایم اے - 7/8 مرے)

یورو نے اکتوبر کے آغاز میں ایک خلا چھوڑ دیا جسے ابھی پُر کرنے کی ضرورت ہے، لہذا اگر قیمت 7/8 مرے کی سطح سے اوپر جاتی

Dimitrios Zappas 17:06 2025-10-30 UTC+2

جی بی پی / یو ایس ڈی کی پیشن گوئی برائے 30 اکتوبر 2025

گھنٹہ وار چارٹ پر، بدھ کو جی بی پی / یو ایس ڈی پئیر 1.3247 پر 100.0% ریٹیسمنٹ لیول سے ریباؤنڈ ہوا، امریکی ڈالر کے حق میں پلٹ گیا،

Samir Klishi 14:49 2025-10-30 UTC+2

اکتوبر 30 2025 کو یورو / یو ایس ڈی کی پیشن گوئی

بدھ کو، یورو / یو ایس ڈی جوڑا 1.1645–1.1656 کی مزاحمتی سطح سے واپس لوٹا، امریکی ڈالر کے حق میں پلٹ گیا، اور 1.1594 پر 61.8% ریٹیسمنٹ لیول

Samir Klishi 14:26 2025-10-30 UTC+2

اکتوبر 29-31 2025 کے لیے سونے (ایکس اے یو / یو ایس ڈی) کے لیے تجارتی سگنل: $3,951 سے اوپر خریدیں (200 ای ایم اے - 3/8 مرے)

اگر سونے کی قیمت تیزی سے 20 اکتوبر سے بننے والے ڈاؤن ٹرینڈ چینل کو توڑ دیتی ہے، تو ہم ایک نیا تیزی کا سلسلہ دیکھ سکتے

Dimitrios Zappas 17:03 2025-10-29 UTC+2

اکتوبر 29-31 2025 کے لیے بٹ کوائن کے لیے تجارتی سگنل: $113,800 سے نیچے فروخت (21 ایس ایم اے - 5/8 مرے)

اگر مندی کا دباؤ موجودہ قیمت کی سطحوں سے برقرار رہتا ہے، تو ہم BTC کمی کے تسلسل کی توقع کر سکتے ہیں، ممکنہ طور پر $110,800 تک پہنچ جائے

Dimitrios Zappas 16:58 2025-10-29 UTC+2

اکتوبر 29-31 2025 کے لیے یورو / یو ایس ڈی کے لیے تجارتی سگنل: 1.1670 سے نیچے فروخت (21 ایس ایم اے - 200 ای ایم اے)

اگر مندی کا دباؤ غالب رہتا ہے تو اسے فروخت کرنے کا موقع صرف اس صورت میں دیکھا جائے گا جب قیمت 1.1662 سے نیچے مستحکم ہو جائے،

Dimitrios Zappas 16:55 2025-10-29 UTC+2

یو ایس ڈی / جے پی وائے: تجزیہ اور پیشن گوئی - موجودہ مارکیٹ کی صورتحال

تکنیکی نقطہ نظر سے، 153.25–153.30 کی سطح سے اوپر کا وقفہ، جو کہ ماہانہ بلندی کی نشاندہی کرتا ہے، اور اس زون سے باہر خریداری کی سرگرمیوں میں مزید اضافہ،

Irina Yanina 18:27 2025-10-27 UTC+2
ابھی فوری بات نہیں کرسکتے ؟
اپنا سوال پوچھیں بذریعہ چیٹ.
Widget callback
 

Dear visitor,

Your IP address shows that you are currently located in the USA. If you are a resident of the United States, you are prohibited from using the services of InstaFintech Group including online trading, online transfers, deposit/withdrawal of funds, etc.

If you think you are seeing this message by mistake and your location is not the US, kindly proceed to the website. Otherwise, you must leave the website in order to comply with government restrictions.

Why does your IP address show your location as the USA?

  • - you are using a VPN provided by a hosting company based in the United States;
  • - your IP does not have proper WHOIS records;
  • - an error occurred in the WHOIS geolocation database.

Please confirm whether you are a US resident or not by clicking the relevant button below. If you choose the wrong option, being a US resident, you will not be able to open an account with InstaForex anyway.

We are sorry for any inconvenience caused by this message.