Reddit Prepares for NYSE Debut and Delves into Crypto Reserves
Key Takeaways:
- Reddit has filed an S-1 document with the SEC, indicating its plans to list on the New York Stock Exchange and revealing investments in Bitcoin and Ethereum.
- The social media giant has shown a strategic shift towards integrating cryptocurrencies into its treasury operations, currently holding BTC and ETH.
- With the discontinuation of its Community Points, Reddit's focus may now be shifting more towards leveraging cryptocurrencies for broader corporate goals.
Social Media Meets Wall Street and Crypto:
In a bold convergence of social media, traditional finance, and cryptocurrency, Reddit has announced its intention to enter the stock market, specifically targeting a spot on the New York Stock Exchange. The platform's recent S-1 filing not only signifies its IPO ambitions but also unveils its venture into the digital asset space with investments in Bitcoin (BTC) and Ethereum (ETH).
Strategic Crypto Investment:
According to the filing, Reddit has dedicated a portion of its excess cash reserves to cryptocurrencies, acquiring both ETH and the layer 2 network token Polygon (MATIC). These digital assets are earmarked for use by the company's product and engineering teams, with a clear limitation to specific applications.
The Treasury's Digital Assets:
As of December 31, Reddit's net book value of BTC and ETH holdings was reportedly "immaterial," suggesting a cautious entry into the crypto domain. The company also stated its intent to refrain from investing in additional cryptocurrencies unless they are classified as non-securities by federal regulators, indicating a prudent approach to the volatile crypto market.
A Pivot From Community Tokens:
Reddit has a storied history with blockchain and cryptocurrency, having previously launched its own ERC-20 based Community Points in 2020. These tokens enjoyed significant popularity among its user base but were phased out due to scalability issues on the platform. This move away from proprietary tokens could signify a shift in Reddit's blockchain strategy towards more widely recognized digital assets like Bitcoin and Ethereum.
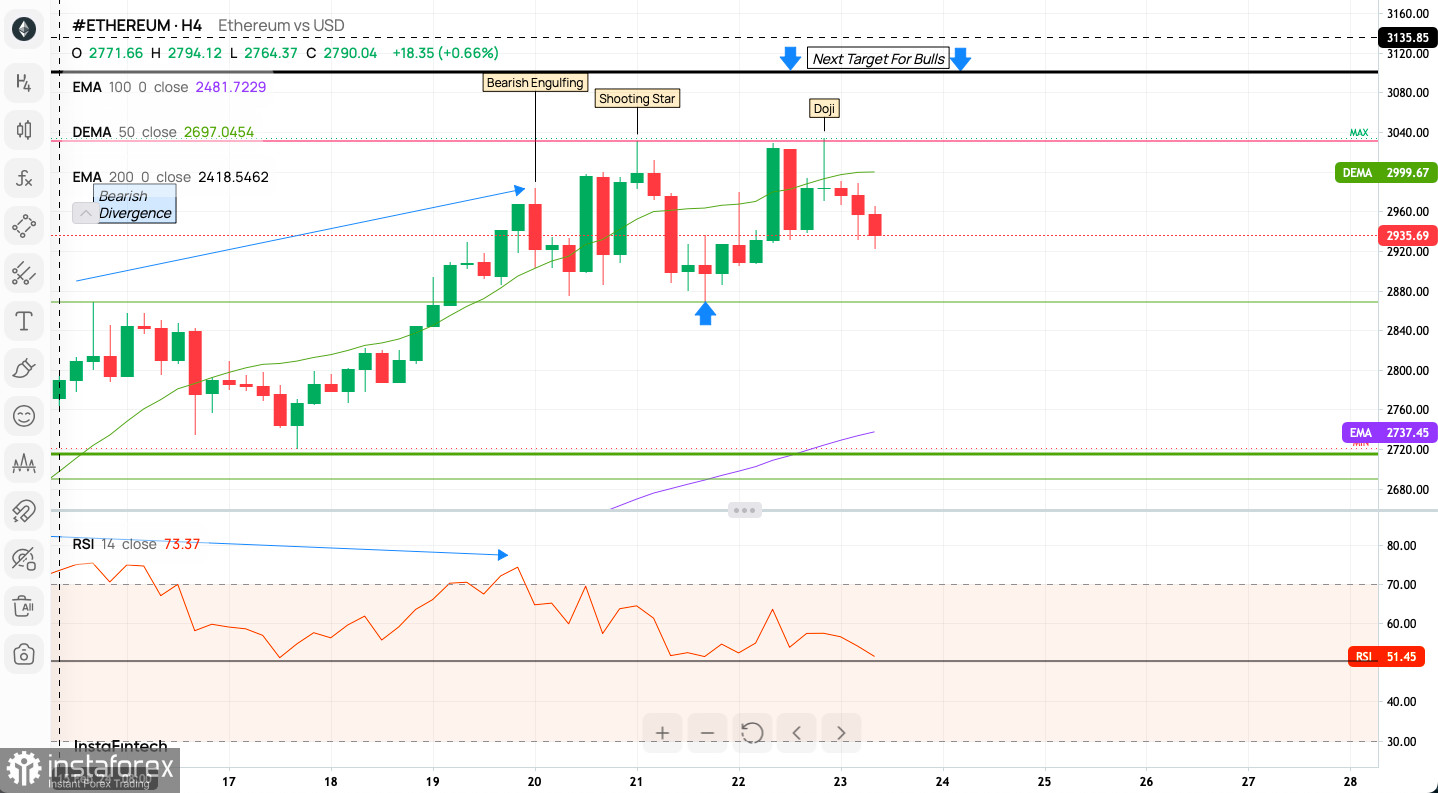
Technical Analysis of Ethereum:
The ETH/USD H4 chart presents a mixed technical outlook. While the overall sentiment is extremely bullish, with a significant majority of participants leaning towards further price increases, technical indicators suggest caution. A substantial number of both technical indicators and moving averages are signaling a sell, potentially hinting at an impending correction or consolidation phase.
- Intraday 1H Indicator Signals:
- The majority of technical indicators (19 out of 23) are signaling a Sell, suggesting that in the short-term timeframe, the momentum could be turning bearish.
- Similarly, most moving averages (14 out of 18) are indicating a Sell signal, reinforcing the potential bearish bias in the short term.
- Sentiment Scoreboard:
- Despite the short-term bearish signals from technical indicators and moving averages, the general sentiment is very bullish. This could indicate that traders are expecting the price to rise in the longer term.
- The increasing bullish sentiment over the last week and the past three days could contribute to buying pressure, possibly leading to the continuation of the upward trend if the sentiment translates into actual market moves.
- Trend Analysis:
- Ethereum has been exhibiting a bullish trend, as indicated by the ascending support line. The price is trading above the 100 and 200-period Exponential Moving Averages (EMAs), which is generally considered a bullish signal.
- Candlestick Patterns:
- There is a Bearish Engulfing pattern, which could indicate a potential reversal or a pullback from the recent uptrend.
- A Shooting Star is visible, which is another bearish reversal pattern, usually relevant when it appears after an uptrend.
- The presence of a Doji candle signifies indecision in the market, often found at the top of an uptrend or bottom of a downtrend.
- Support and Resistance Levels:
- The chart identifies a "Next Target For Bulls" around the 3135-3160 level, suggesting this is a resistance area where the price might struggle to break higher.
- The ascending support line below the current price level acts as dynamic support.
- Moving Averages:
- The 50-period DEMA is above the current price, which could act as immediate resistance.
- The 100 and 200-period EMAs are below the current price, serving as support levels.
- Momentum Indicators:
- The Relative Strength Index (RSI) is around 51.45, having come down from an overbought condition (above 70), indicating that the momentum may be slowing down.
- Divergence:
- The chart points out a "Bearish Divergence" with the RSI, where the price makes higher highs, but the RSI does not, often indicating a potential reversal.
- Weekly Pivot Points:
- These pivot points provide potential levels of support (WS1, WS2, WS3) and resistance (WR1, WR2, WR3) for the week.
- The current price, as per the chart, is above the Weekly Pivot, indicating that the market is leaning towards the bullish side in the longer-term weekly perspective.
- The WR3 level at $3,041 is just above the "Next Target For Bulls" mentioned on the chart, aligning with the identified resistance zone
Revised Summary: While the 1-hour technical indicators and moving averages suggest a bearish bias in the short term, the general sentiment remains very bullish, which could mean that any dips are seen as buying opportunities by the market participants. The weekly pivot points suggest that the price is currently in a bullish zone above the weekly pivot level of $2,896. The resistance levels at WR1 and WR2 are close to the current price, with WR3 lining up with the resistance target for bulls on the chart.
Given the divergence between the intraday technical signals and the bullish sentiment, traders should monitor these levels closely:
- If the price maintains above the weekly pivot and approaches the WR3, the bullish sentiment could lead to a breakthrough.
- If the price drops below the weekly pivot, the bearish technical indicators could take over, leading to further downside towards the support levels (WS1, WS2).
Traffic Light Indicator:
- Green: The price above the 100 and 200-period EMAs indicates a bullish trend.
- Amber: The bearish candlestick patterns and RSI divergence signal caution and a potential reversal.
- Red: A break below the ascending support line or a close below the 100-period EMA could confirm a bearish trend change.
Traders may look for confirmation of the trend direction with additional candlestick patterns, volume analysis, and whether the RSI divergence continues to develop.
In Conclusion:
Reddit's move to list on the NYSE and its crypto reserve investments reflect a strategic alignment with both traditional and emerging financial trends. The company's departure from its own blockchain tokens to a broader embrace of established cryptocurrencies could herald a new era for Reddit, blending the worlds of social media, finance, and blockchain technology.
Useful Links
Important Notice
The begginers in forex trading need to be very careful when making decisions about entering the market. Before the release of important reports, it is best to stay out of the market to avoid being caught in sharp market fluctuations due to increased volatility. If you decide to trade during the news release, then always place stop orders to minimize losses.
Without placing stop orders, you can very quickly lose your entire deposit, especially if you do not use money management and trade large volumes. For successful trading, you need to have a clear trading plan and stay focues and disciplined. Spontaneous trading decision based on the current market situation is an inherently losing strategy for a scalper or daytrader.
#instaforex #analysis #sebastianseliga