GBP/USD
Analysis:
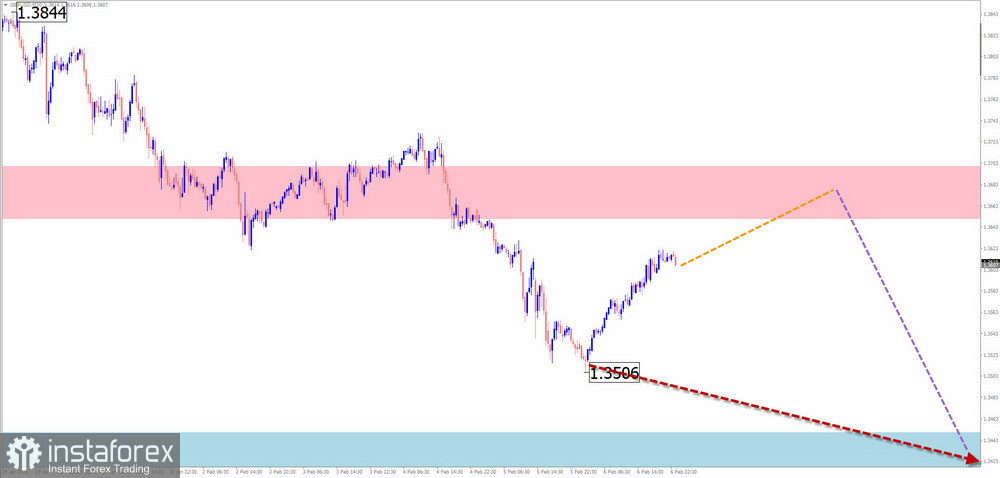
The direction of short-term fluctuations of the British pound sterling on the chart is defined by the algorithm of a bullish wave that started in early November last year. Within the wave structure, the middle part (B), forming as a shifting flat, is nearing completion. At the time of analysis, quotes are located in a horizontal range between the nearest opposing zones.
Forecast:
At the beginning of the current week, price movement of the British pound along the resistance zone is likely. In the second half of the week, a reversal formation and a resumption of the downward trend can be expected. The support zone limits the scope of the pair's weekly growth.
Potential Reversal Zones
Resistance:
Support:
Recommendations:
Buy: Low potential and high risk.Sell: Can be used intraday after appropriate reversal signals appear in the resistance area.
AUD/USD
Analysis:
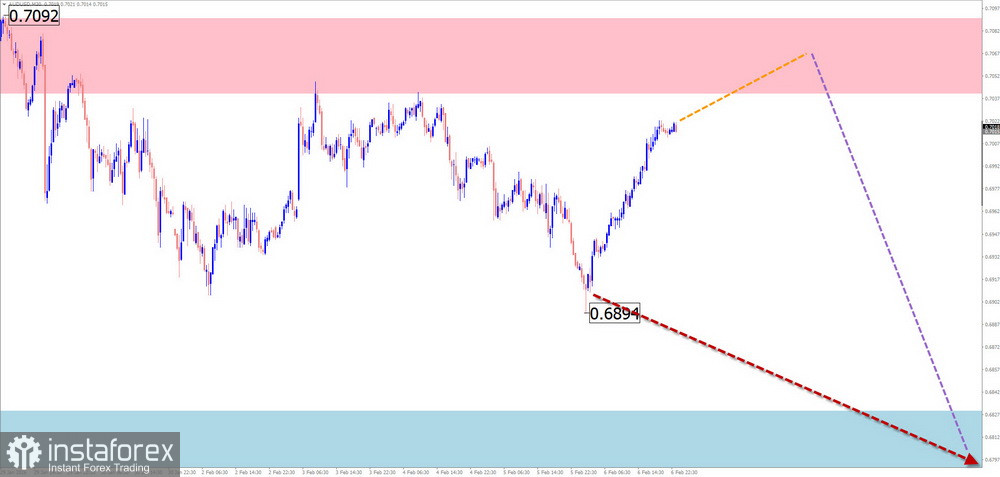
The bullish wave that has defined the main trend direction of the Australian dollar major pair since April last year has reached the boundaries of a potential reversal zone on a higher timeframe. Over the past week, a counter wave has been developing within a sideways flat structure. The movement has reversal potential and does not appear complete at the time of analysis.
Forecast:
Over the next couple of days, a gradual price movement along the resistance zone levels is expected. From this zone, a reversal and resumption of the pair's downward movement can be anticipated. The lower boundary of the expected weekly range is indicated by calculated support.
Potential Reversal Zones
Resistance:
Support:
Recommendations:
Buy: Due to the limited upward potential, such trades may be unprofitable.Sell: Will become relevant only after appropriate signals appear near resistance on your trading systems.
USD/CHF
Analysis:
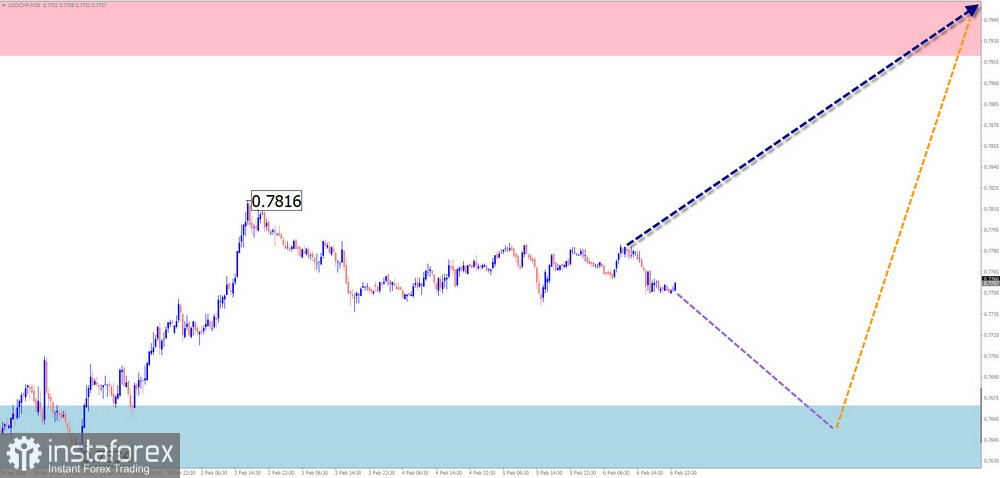
On the Swiss franc chart, the formation of an upward wave that started in April last year continues. The wave structure forms a shifting flat and lacks its final segment. The price is within a potential reversal zone on the daily timeframe. The upward segment from January 27 has reversal potential.
Forecast:
At the beginning of the coming week, continuation of sideways movement with a downward vector is expected, up to full completion near the support area. Pressure on the zone is possible, with a short-term break below its lower boundary. In the second half of the week, a reversal formation and resumption of price growth can be expected.
Potential Reversal Zones
Resistance:
Support:
Recommendations:
Sell: Allowed with reduced position size within individual trading sessions; risky.Buy: Will become safer after reversal signals appear near the support zone on your trading systems.
EUR/JPY
Analysis:
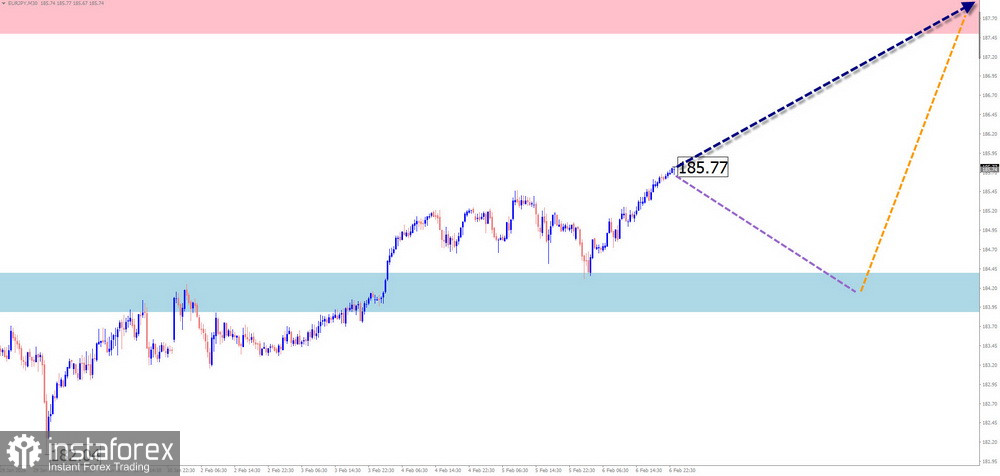
After the correction completed in February last year, the next segment of the main bullish trend of the EUR/JPY pair is developing. Over the past three weeks, a hidden correction has formed within the wave structure. The upward segment from January 26 currently does not show sufficient reversal potential to complete the correction.
Forecast:
During the upcoming weekly period, continuation of sideways price movement can be expected. Over the next day or two, another decline toward support is possible. Closer to the weekend, a reversal formation and resumption of price growth are anticipated. Calculated resistance indicates the upper boundary of the pair's weekly range.
Potential Reversal Zones
Resistance:
Support:
Recommendations:
Sell: Low potential and may result in losses. Buy: There are no conditions for such trades until reversal signals appear.
Ethereum
Analysis:
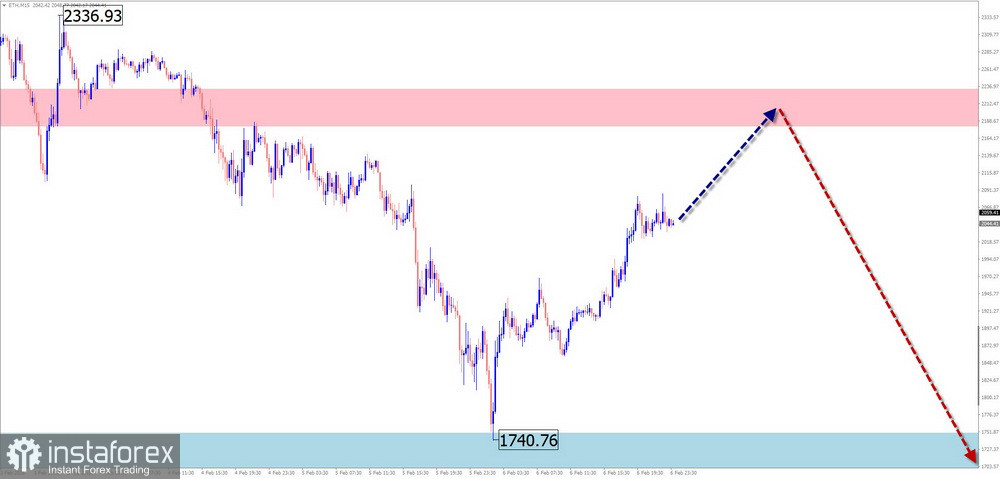
Over the past six months, Ethereum quotes on the chart have been forming a descending wave zigzag. Since mid-January, the final part (C) has been developing within the structure and is not yet complete at the time of analysis. The coin's price is located near clusters of potential reversal zones of different scales.
Forecast:
Over the next couple of days, continuation of the upward movement vector can be expected, up to contact with the resistance zone. After that, a reversal formation within a flat is anticipated. A resumption of price decline is more likely closer to the weekend.
Potential Reversal Zones
Resistance:
Support:
Recommendations:
Buy: Allowed with reduced position size within individual sessions. Potential is limited by resistance.Sell: Will become relevant after confirmed reversal signals appear near the calculated resistance.
Litecoin
Brief Analysis:
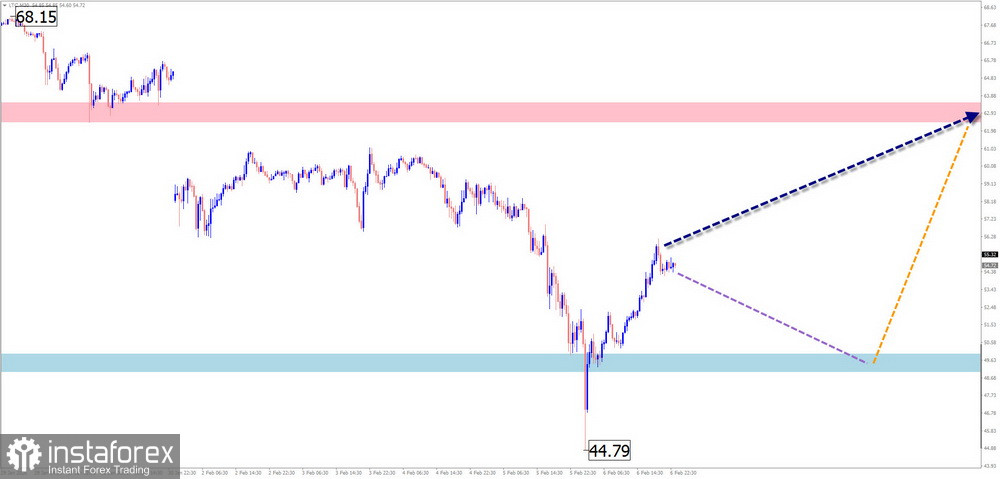
Since October last year, Litecoin price movement has been defined by the algorithm of an unfinished downward wave. In a larger wave model, this segment represents the final part (C). The wave structure is not complete at the time of analysis. The price has reached the upper boundary of the daily timeframe potential reversal zone.
Weekly Forecast:
In the coming week, full completion of the downward movement is expected. Near the calculated support, a reversal formation can then be anticipated. The start of price growth is most likely toward the end of the current week or at the beginning of the next one.
Potential Reversal Zones
Resistance:
Support:
Recommendations:
Buy: Can be used after confirmed reversal signals appear near support on your trading systems.Sell: Possible with reduced position size within individual sessions.
Notes:
In simplified wave analysis (SWA), all waves consist of three parts (A–B–C). On each timeframe, the latest unfinished wave is analyzed. Dotted lines show the expected movements.
Attention: The wave algorithm does not take into account the duration of instrument movements over time.