empty
12.08.2025 11:46 AM
Forecast for EUR/USD on August 12, 2025

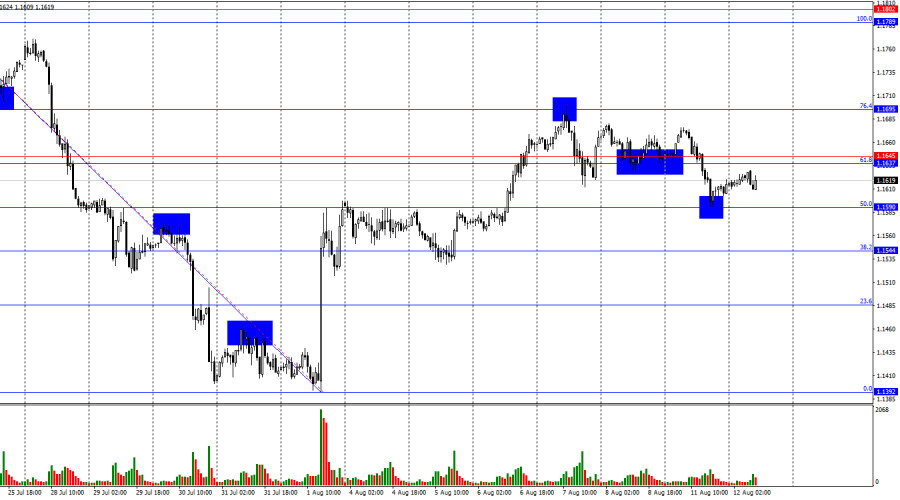
On Monday, the EUR/USD pair declined to the 50.0% retracement level at 1.1590 and rebounded from it. As a result, a reversal in favor of the euro was completed. The upward movement may continue toward the resistance zone of 1.1637–1.1645. Consolidation above this zone would favor further growth toward the levels of 1.1695 and 1.1789. A rebound from the 1.1637–1.1645 zone would favor the U.S. currency and a continuation of the decline toward the levels of 1.1590 and 1.1544.
This image is no longer relevant

The wave structure on the hourly chart remains straightforward. The last completed upward wave broke the high of the previous wave, while the last completed downward wave broke the previous low. Therefore, the trend can be considered "bearish" for now, but recently it has been changing frequently due to the news background. Donald Trump managed to sign several favorable deals, which supported the bears, as did Jerome Powell's statements after the latest Fed meeting. However, recent labor market data and the changed outlook for Fed monetary policy now support the bulls.

On Monday, there was no significant news background, but the bears still made an attempt to push the pair lower. The move was weak, as today's U.S. inflation report is highly anticipated. This report may influence the FOMC's decision at its next meeting. At present, traders expect a rate cut at the September FOMC meeting, but will policymakers be ready to vote for a cut if inflation rises to, for example, 3%? In my view, the answer is not straightforward. If inflation comes in high today, the chances of monetary policy easing in September will likely decrease. The stronger the inflation increases, the lower the chances. Thus, high inflation would support the bears. At this point, an increase in U.S. inflation seems the most likely outcome.
This image is no longer relevant

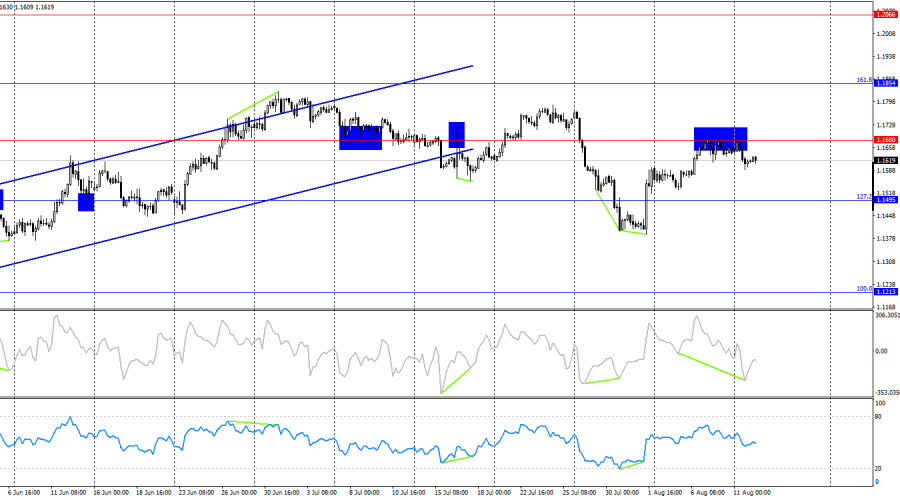
On the four-hour chart, the pair reversed in favor of the euro and rose to the 1.1680 level after forming two bullish divergences. A rebound from this level suggests a possible decline toward the 127.2% retracement level at 1.1495. Consolidation above 1.1680 would increase the likelihood of continued growth toward the next Fibonacci level of 161.8% at 1.1854. No emerging divergences are currently observed on any indicator, and a move below the ascending channel does not necessarily mean a bearish trend will form.

Commitments of Traders (COT) report:

This image is no longer relevant

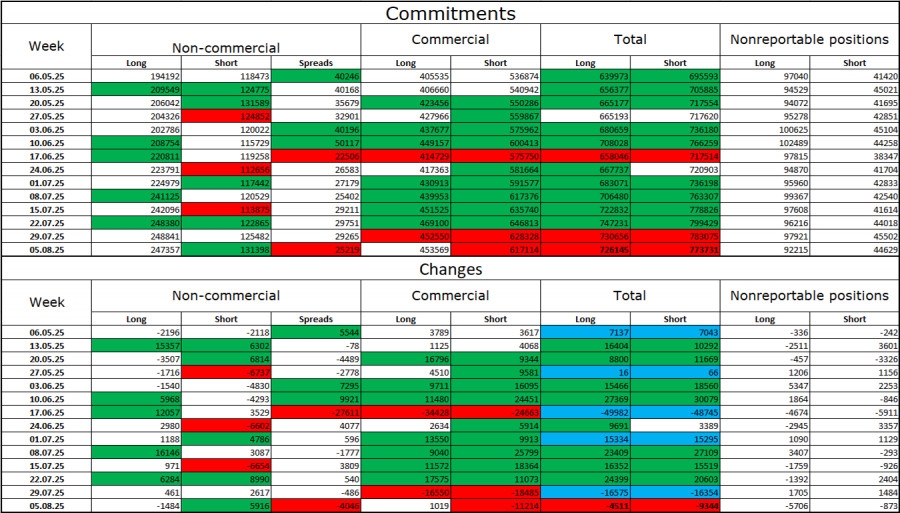
Over the last reporting week, professional traders closed 1,848 long positions and opened 5,916 short positions. The sentiment of the "Non-commercial" group remains bullish, largely due to Donald Trump's policies, and is strengthening over time. The total number of long positions held by speculators now stands at 247,000, compared to 131,000 short positions — almost a twofold difference. In addition, note the large number of green cells in the table above, indicating a strong build-up of positions in the euro. In most cases, interest in the euro is growing while interest in the dollar is declining.

For 26 consecutive weeks, large market players have been reducing their short positions and increasing their longs. Donald Trump's policies remain a major factor for traders, as they could create long-term and structural challenges for the U.S. economy. Despite signing several important trade agreements, some key economic indicators are showing declines.

News calendar for the U.S. and Eurozone:

Eurozone – ZEW Economic Sentiment Index (09:00 UTC). Germany – ZEW Economic Sentiment Index (09:00 UTC). U.S. – Consumer Price Index (12:30 UTC).

On August 12, the economic calendar contains three entries, one of which is considered important. The news background is expected to influence market sentiment in the second half of the day.

EUR/USD forecast and trading tips:

Selling the pair was possible upon an hourly close below the 1.1637–1.1645 zone with targets at 1.1590 and 1.1544. The first target has been reached. Today, sales are possible with the same targets in case of a rebound from the 1.1637–1.1645 zone. Buying could be initiated from a rebound off 1.1590 on the hourly chart. Today, such positions can be held with targets at 1.1637 and 1.1695.

Fibonacci grids are built from 1.1789 to 1.1392 on the hourly chart and from 1.1214 to 1.0179 on the four-hour chart.

Samir Klishi,
Analytical expert of InstaForex
© 2007-2025
Summary
Urgency
Analytic
Grigory Sokolov
Start trade
Earn on cryptocurrency rate changes with InstaForex
Download MetaTrader 4 and open your first trade
  • Grand Choice
    Contest by
    InstaForex
    InstaForex always strives to help you
    fulfill your biggest dreams.
    JOIN CONTEST

Recommended Stories

Forex forecast 04/11/2025: EUR/USD, GBP/USD AUD/USD, NZD/USD, SP500 and Bitcoin

Useful links: My other articles are available in this section InstaForex course for beginners Popular Analytics Open trading account Important: The begginers in forex trading need to be very careful

Sebastian Seliga 15:20 2025-11-04 UTC+2

EUR/USD Forecast on November 4, 2025

On Monday, the EUR/USD pair continued its decline — one that no longer follows any "rules." Yesterday, we saw that the information background was once again ignored, and now even

Samir Klishi 10:46 2025-11-04 UTC+2

GBP/USD Forecast on November 4, 2025

On the hourly chart, the GBP/USD pair traded horizontally on Monday within the support level of 1.3110–1.3139. Thus, as of Tuesday morning, the price has not yet performed either

Samir Klishi 10:43 2025-11-04 UTC+2

GBP/USD. Technical Analysis on November 4, 2025

Trend Analysis (Fig. 1).On Tuesday, the market from the level of 1.3136 (the close of yesterday's daily candle) may begin moving downward toward the target of 1.3077 — the 176.4%

Stefan Doll 10:27 2025-11-04 UTC+2

EUR/USD. Technical Analysis on November 4, 2025

On Monday, the pair moved within a sideways channel, closing the daily candle at 1.1518. Today, the price may begin an upward movement. On Tuesday, strong calendar news is expected

Stefan Doll 09:10 2025-11-04 UTC+2

With the Golden Cross condition of its EMAs, Natural Gas seems likely to strengthen today. November 04, 2025.

[Natural Gas] – [Tuesday, November 04, 2025] With all technical indicators indicating bullish conditions for Natural Gas, today #NG has the potential to move toward its nearest resistance level

Arief Makmur 06:46 2025-11-04 UTC+2

Crude Oil seems set to strengthen today toward its nearest resistance level.Tuesday, November 04, 2025.

[Crude Oil] – [Tuesday, November 04, 2025] Although the RSI remains in the Neutral-Bearish zone, but with both EMAs intersecting the Golden Cross, it gives an indication that there

Arief Makmur 06:46 2025-11-04 UTC+2

Trading Signals for GOLD (XAU/USD) for November 4-6, 2025: buy above $3,956 (21 SMA - 200 EMA)

The Eagle indicator is showing a positive signal, so we will look for buying opportunities in gold in the coming hours if the price consolidates within the ascending trend channel

Dimitrios Zappas 05:27 2025-11-04 UTC+2

Trading Signals for BITCOIN for November 4-6, 2025: buy above $106,200 (21 SMA - 2/8 Murray)

Bitcoin is trading around $106,574 within a descending trend channel formed on October 27th, bouncing after reaching the key 2/8 Murray support level. If Bitcoin's price consolidates above the 2/8

Dimitrios Zappas 05:25 2025-11-04 UTC+2

Trading Signals for EUR/USD for November 4-6, 2025: buy above 1.1470 (21 SMA - 6/8 Murray)

If EUR/USD consolidates above 1.1470, we could expect a technical rebound, potentially returning the price to the 7/8 Murray price level at 1.1596 and even

Dimitrios Zappas 05:23 2025-11-04 UTC+2
Can't speak right now?
Ask your question in the chat.
Widget callback
 

Dear visitor,

Your IP address shows that you are currently located in the USA. If you are a resident of the United States, you are prohibited from using the services of InstaFintech Group including online trading, online transfers, deposit/withdrawal of funds, etc.

If you think you are seeing this message by mistake and your location is not the US, kindly proceed to the website. Otherwise, you must leave the website in order to comply with government restrictions.

Why does your IP address show your location as the USA?

  • - you are using a VPN provided by a hosting company based in the United States;
  • - your IP does not have proper WHOIS records;
  • - an error occurred in the WHOIS geolocation database.

Please confirm whether you are a US resident or not by clicking the relevant button below. If you choose the wrong option, being a US resident, you will not be able to open an account with InstaForex anyway.

We are sorry for any inconvenience caused by this message.