empty
10.04.2025 03:21 AM
Trading Recommendations and Analysis for EUR/USD on April 10: 500% Tariffs for China!

EUR/USD 5-Minute Analysis

This image is no longer relevant

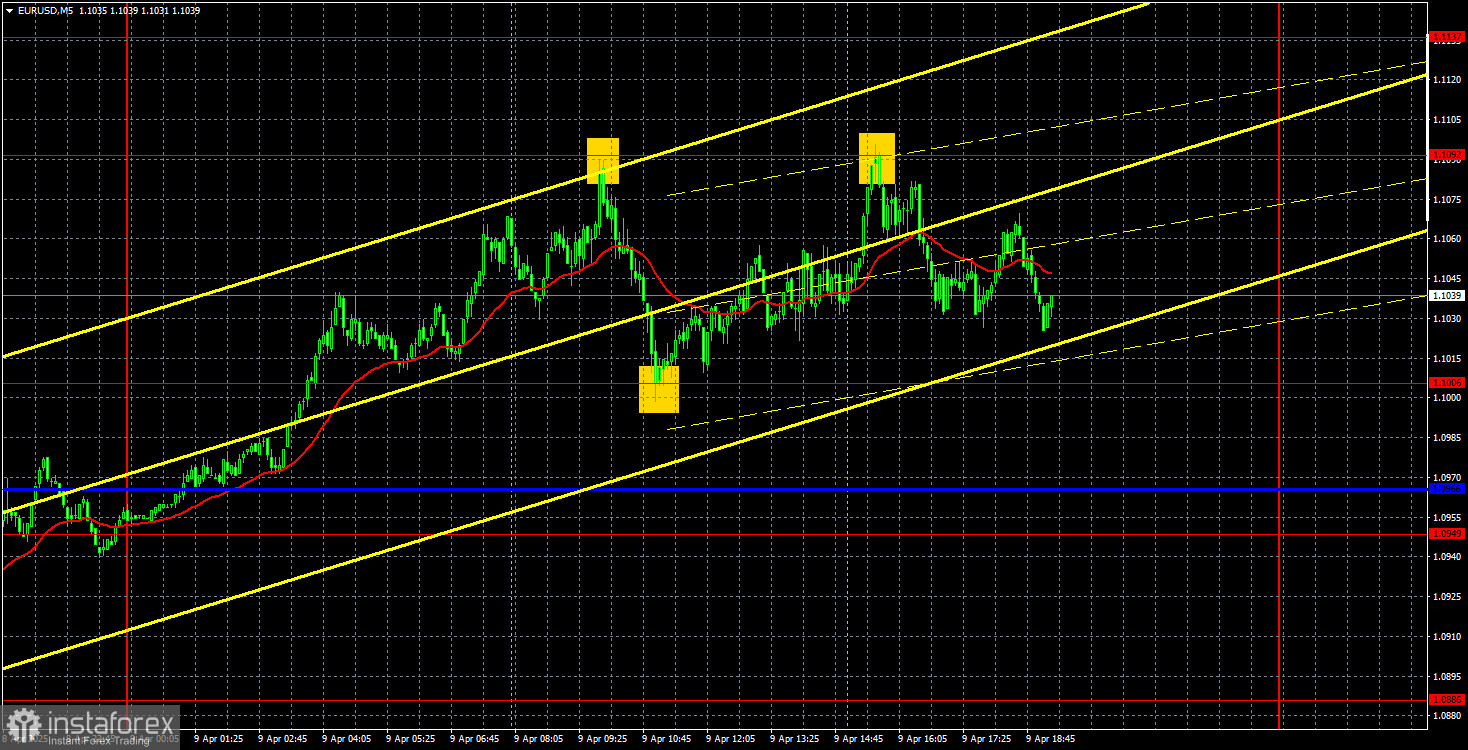
On Wednesday, the EUR/USD currency pair moved exactly as expected — in several aspects. First, let's start with the "triangle" pattern we discussed yesterday. We warned that such formations often precede a new upward movement. However, before this rise begins, the price might falsely break through the lower boundary and mislead traders. That's precisely what happened. We should also mention that Trump raised tariffs on China to an unbelievable 104%, and in response, China imposed 84% tariffs on Wednesday. Thus, the trade war between the U.S. and China continues to escalate — a development that can only negatively affect the U.S. dollar.

But the "icing on the cake" was the news of a proposed 500% tariff on China, suggested by a Trump administration member on Wednesday. It's not just the U.S. President who's hostile toward the world — his entire team appears to share the sentiment. Well then, if it's 500%, so be it. If Trump implements such absurdly high tariffs, we have little doubt that China will retaliate. Beijing has repeatedly shown that it is ready to meet force with force.

Regarding Wednesday's trading signals, there were three precise bounces from key levels — two from 1.1092 and one from 1.1006. In all three cases, the nearby targets (those same levels) were reached or nearly reached. These three signals could have generated about 120–150 pips in profit. Market chaos and panic persist, so prices may fly in either direction at any moment.

COT Report

This image is no longer relevant

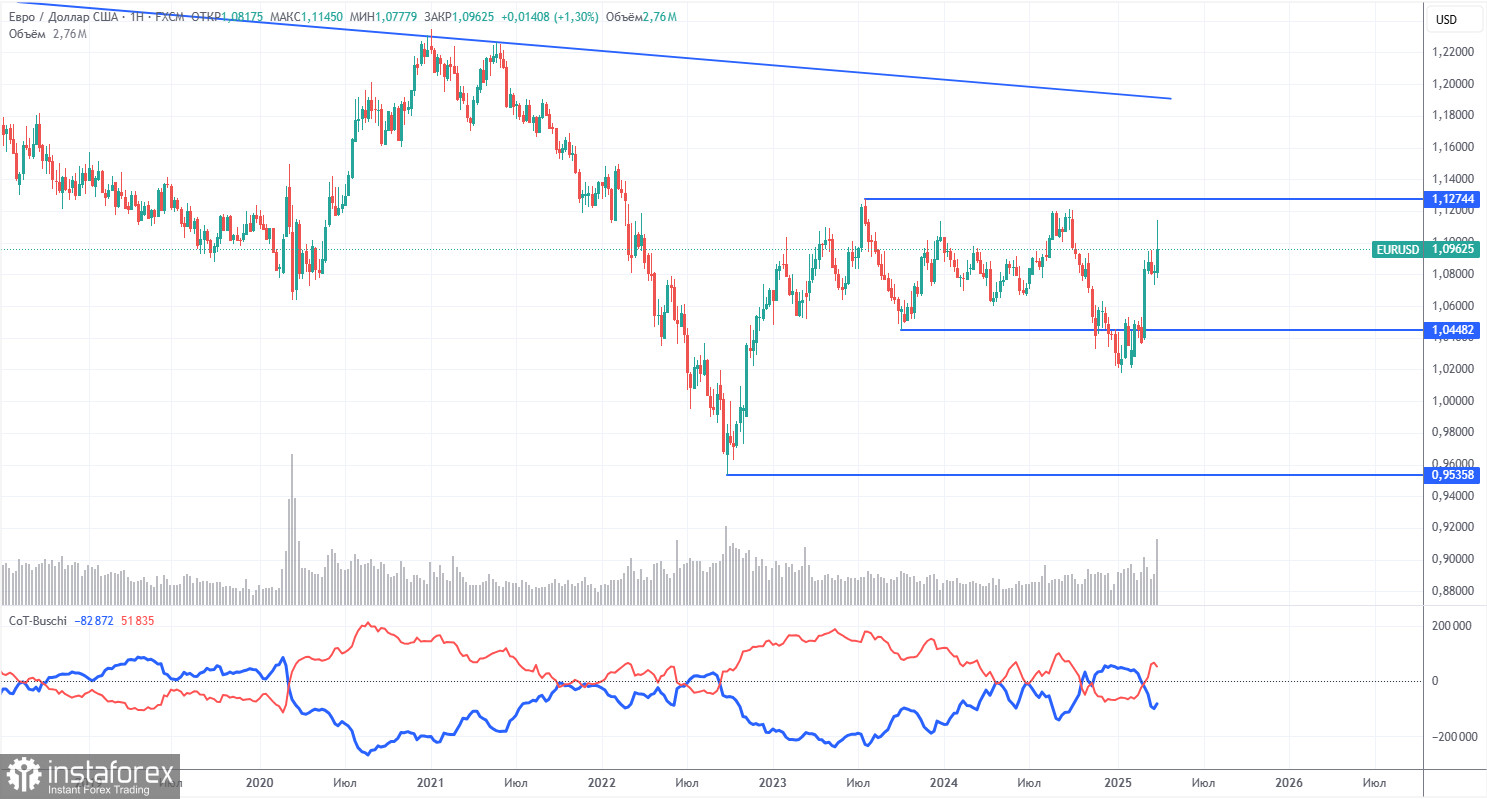
The latest COT report is dated April 1. As shown in the chart, the net position of non-commercial traders remained bullish for a long time. The bears barely managed to gain control briefly, but now the bulls are back in charge. The bears' advantage has faded fast since Trump took office, and the dollar has since plunged. We cannot say definitively that the dollar's decline will continue, and the COT reports reflect sentiment among major players, which can shift quickly in today's environment.

We still see no fundamental factors supporting euro strength—but one decisive factor for dollar weakness has emerged. The correction may last for weeks or even months, but a 16-year downward trend isn't going to end so quickly.

The red and blue lines have crossed again, indicating a bullish market trend. During the latest reporting week, the number of long positions in the "non-commercial" group fell by 6,500, while short positions increased by 7,100. As a result, the net position declined by 13,600 contracts.

EUR/USD 1-Hour Analysis

This image is no longer relevant

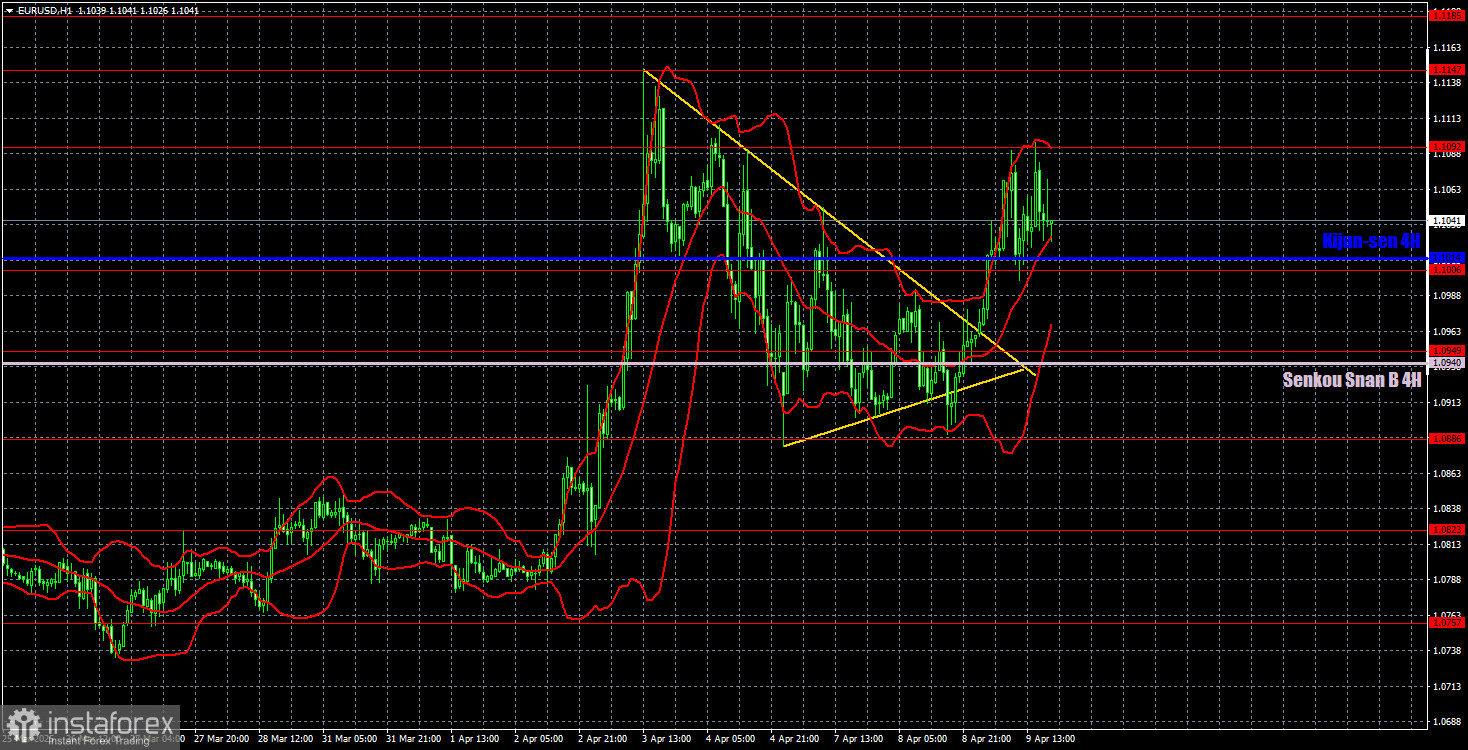
In the hourly time frame, EUR/USD quickly resumed its upward movement once Trump began implementing new tariffs. We believe the decline will eventually resume in the medium term due to the divergence in ECB and Fed monetary policies. However, it's unclear how long the market will continue pricing in just the "Trump factor" — and where the pair will ultimately end up. Or how long will Trump himself keep stirring up global tensions? Right now, the markets are dominated by panic and chaos, so if we had previously avoided forecasting price movements even a week ahead, it's even more difficult now. Our only advice is to wait until the "crisis" eases or stick to intraday trading only.

On April 10, we highlight the following levels for trading - 1.0461, 1.0524, 1.0585, 1.0658-1.0669, 1.0757, 1.0797, 1.0823, 1.0886, 1.0949, 1.1006, 1.1092, 1.1147, 1.1185, 1.1234, as well as the Senkou Span B (1.0940) and Kijun-sen (1.1014) lines. Ichimoku indicator lines may shift during the day, which should be considered when determining trading signals. Don't forget to set your Stop Loss to breakeven once the price moves 15 pips in the right direction. This protects you in case the signal turns out to be false.

As for Thursday's fundamentals, the U.S. Consumer Price Index is worth noting — but we doubt many care about that right now. Inflation may drop to 2.6%, but what does that matter if it can spike back to 5% in 2025 due to Trump's tariffs? We doubt that the Fed's stance will change because inflation drops slightly.

Illustration Explanations:

  • Support and Resistance Levels (thick red lines): Thick red lines indicate where movement may come to an end. Please note that these lines are not sources of trading signals.
  • Kijun-sen and Senkou Span B Lines: Ichimoku indicator lines transferred from the 4-hour timeframe to the hourly timeframe. These are strong lines.
  • Extreme Levels (thin red lines): Thin red lines where the price has previously bounced. These serve as sources of trading signals.
  • Yellow Lines: Trendlines, trend channels, or any other technical patterns.
  • Indicator 1 on COT Charts: Represents the net position size for each category of traders.
Paolo Greco,
Analytical expert of InstaForex
© 2007-2025
Summary
Urgency
Analytic
Stanislav Polyanskiy
Start trade
Earn on cryptocurrency rate changes with InstaForex
Download MetaTrader 4 and open your first trade
  • Grand Choice
    Contest by
    InstaForex
    InstaForex always strives to help you
    fulfill your biggest dreams.
    JOIN CONTEST

Recommended Stories

How to Trade the GBP/USD Currency Pair on November 4? Simple Tips and Trade Analysis for Beginners

On Monday, the GBP/USD pair made yet another attempt to break through the level of 1.3107, resulting in a third bounce. However, traders are not giving up and will attempt

Paolo Greco 07:06 2025-11-04 UTC+2

How to Trade the EUR/USD Currency Pair on November 4? Simple Tips and Trade Analysis for Beginners

On Monday, the EUR/USD currency pair continued its downward movement with minimal volatility. The low volatility observed in recent weeks did not raise any concerns, as important macroeconomic reports have

Paolo Greco 07:06 2025-11-04 UTC+2

Trading Recommendations and Trade Analysis for GBP/USD on November 4. The Pound Continues to Crawl

The GBP/USD currency pair on Monday attempted for the third time to break through the updated support level at 1.3115. There were again no grounds for the decline

Paolo Greco 02:04 2025-11-04 UTC+2

Trading Recommendations and Trade Analysis for EUR/USD on November 4. ISM Index Did Not Help

The EUR/USD currency pair traded with less than 40 pips of volatility on Monday. This article could almost end here, as it is clear that no macroeconomic report

Paolo Greco 02:04 2025-11-04 UTC+2

How to Trade the GBP/USD Currency Pair on November 3? Simple Tips and Trade Analysis for Beginners

The GBP/USD pair continued its downward movement on Friday but bounced back by the end of the day. As a reminder, the British pound has been falling for an entire

Paolo Greco 06:29 2025-11-03 UTC+2

How to Trade the EUR/USD Currency Pair on November 3? Simple Tips and Trade Analysis for Beginners

The EUR/USD currency pair continued its downward movement on Friday for somewhat dubious reasons. On the last trading day of the week, the only event that might have interested novice

Paolo Greco 06:29 2025-11-03 UTC+2

Trading Recommendations and Analysis of GBP/USD for November 3. Is the Pound Preparing for the Bank of England Meeting?

The GBP/USD currency pair avoided a new decline on Friday, though in the first half of the day, it was poised to extend its decline. There were no significant news

Paolo Greco 03:32 2025-11-03 UTC+2

Trading Recommendations and Analysis of EUR/USD for November 3. Inflation in the EU – a New Reason to Sell

The EUR/USD currency pair continued its downward movement on Friday after breaking through another ascending trendline. As mentioned, there is an ongoing flat trend on the daily timeframe

Paolo Greco 03:32 2025-11-03 UTC+2

How to Trade the GBP/USD Currency Pair on October 31? Simple Tips and Trade Analysis for Beginners

On Thursday, the GBP/USD pair continued its downward movement despite no noteworthy events in either the UK or the US. However, the FOMC results were announced the day before

Paolo Greco 06:42 2025-10-31 UTC+2

How to Trade the EUR/USD Currency Pair on October 31? Simple Tips and Trade Analysis for Beginners

The EUR/USD pair continued its decline on Thursday after breaching yet another ascending trend line the day before. The European currency is falling again; the flat on the daily timeframe

Paolo Greco 06:42 2025-10-31 UTC+2
Can't speak right now?
Ask your question in the chat.
Widget callback
 

Dear visitor,

Your IP address shows that you are currently located in the USA. If you are a resident of the United States, you are prohibited from using the services of InstaFintech Group including online trading, online transfers, deposit/withdrawal of funds, etc.

If you think you are seeing this message by mistake and your location is not the US, kindly proceed to the website. Otherwise, you must leave the website in order to comply with government restrictions.

Why does your IP address show your location as the USA?

  • - you are using a VPN provided by a hosting company based in the United States;
  • - your IP does not have proper WHOIS records;
  • - an error occurred in the WHOIS geolocation database.

Please confirm whether you are a US resident or not by clicking the relevant button below. If you choose the wrong option, being a US resident, you will not be able to open an account with InstaForex anyway.

We are sorry for any inconvenience caused by this message.